

Karen Oberhauser, Monarch Butterfly Fund Board of Directors and Professor Emerita of UW-Madison Department of Entomology
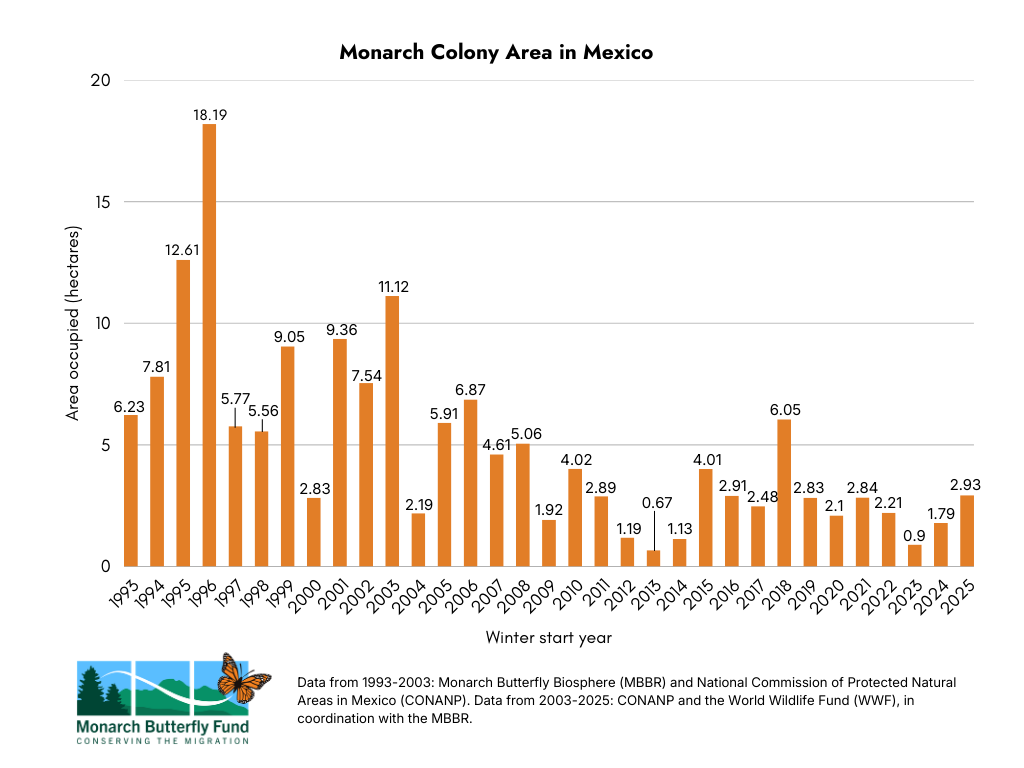
On March 17, 2026 the World Wildlife Fund-Telmex Telcel Foundation Alliance (WWF) and the National Commission of Protected Natural Areas in Mexico (CONANP) released data from the winter 2025–2026 monarch population counts. In December 2025, monarchs occupied 2.93 hectares, compared to 1.79 hectares at the same time in 2024. This area is slightly higher than the average of 2.81 hectares over the past decade and represents a 64% increase over last year’s area.
At the wintering sites in central Mexico, where most monarchs from east of the Rocky Mountains overwinter, monarch population size is compared from year to year by the number of hectares (one hectare = 2.47 acres) occupied by trees with clusters of monarchs. WWF and CONANP have been monitoring this area since 2004, with similar data from 1993-2003 collected by the Monarch Butterfly Biosphere Reserve (MBBR). While the number of monarchs clustering in a hectare varies from year to year and is difficult to estimate, our best estimate is that it is about 21 million.
The monarchs that migrate to Mexico each autumn represent the culmination of an amazing multi-generational story. Beginning each spring, monarchs fly north from the Mexican wintering sites, mating and laying eggs as they move into the southeastern quarter of the US. Their offspring become the first generation of the new year and will fly further north into their summer breeding range (roughly the northeastern quarter of the US and southern Canada), where they and their progeny and grand progeny will mate and lay eggs throughout May to August. The final generation of the year will fly southward from mid-August through October, then spend the winter at the Mexican wintering sites before beginning a new cycle the following spring. The 2026 story is beginning now, as monarchs that spent the winter of 2025-2026 in Mexico move northward.
Why did monarch numbers in Mexico increase over last year?
The number of monarchs that reach Mexico every autumn is determined by how the population fared over the previous three breeding generations and the success of their migration to Mexico. Thus, their numbers are driven by recruitment (the number of eggs laid and survival to adulthood) and survival during the annual migration. Recruitment and survival are affected by the availability of quality habitat (i.e., milkweed for breeding and nectar sources, particularly during migration), weather conditions, and the presence of lethal agents such as environmental toxins and insecticides, and natural enemies like predators, diseases, and parasites. Land conversion, climate change, and pesticide use can all affect monarch numbers.
It’s challenging to quantify changes in habitat availability on a year-to-year basis, but we know that people throughout the monarchs’ breeding and migratory range are restoring habitat: in yards, workplaces, schools, and churches; along roadsides, utility rights-of-ways, and railroads; and on open land. All of this is positive. It’s also difficult to quantify insecticide use, especially since government agencies are no longer collecting data on applications of widespread agricultural pesticides. We do have good information on the weather, however, which can provide some insights into the differences between the numbers of monarchs that flew south to Mexico in 2024 and 2025.
2024 Weather Conditions
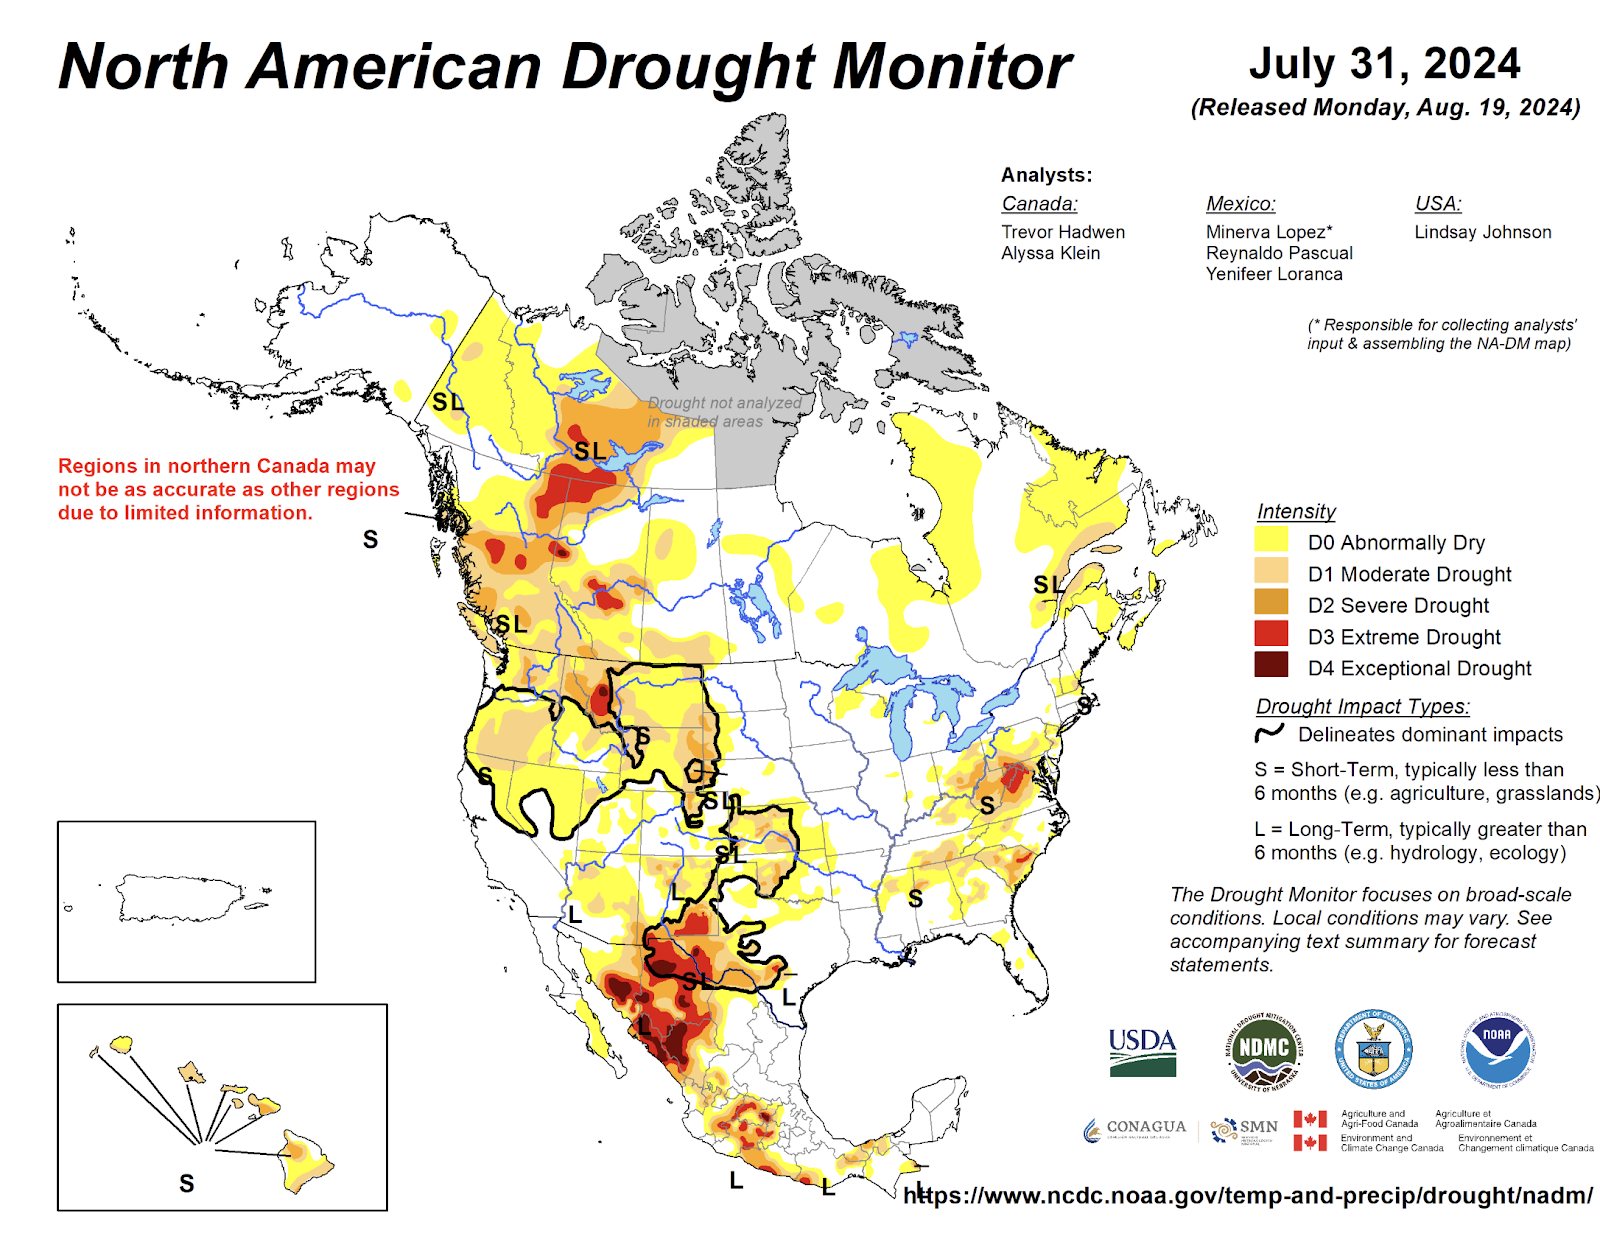
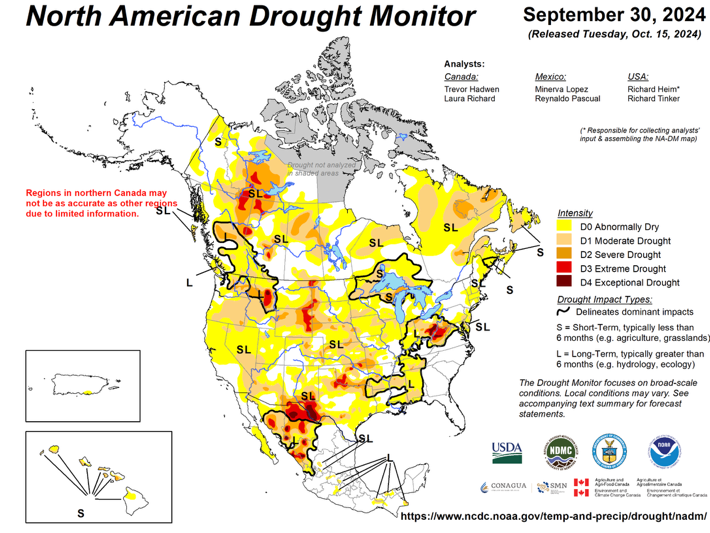
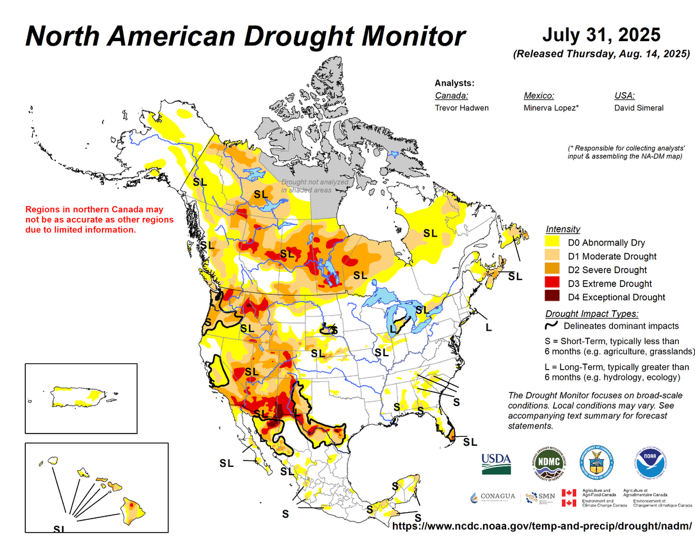
It got hotter and drier in the key Upper-Midwestern monarch breeding range as the summer of 2024 progressed; see drought maps from late July and late September 2024.
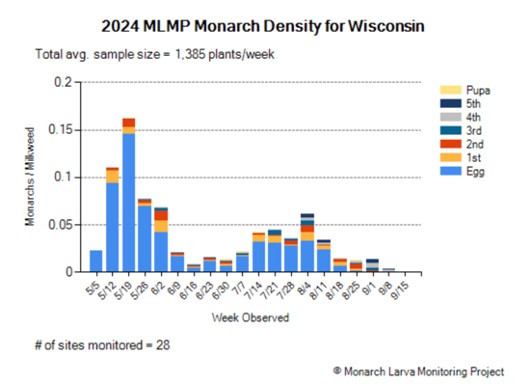
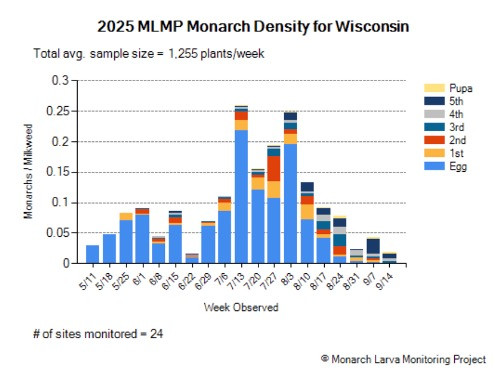
Increasingly dry conditions led to lower-than-expected numbers of monarchs in the second and third generations of 2024, as documented by Monarch Larva Monitoring Project egg and larva densities. The graph below shows monarch densities in Wisconsin, for example, but similar patterns occurred in other states. A lower “second hump” in monarch density is relatively unusual, since the population should be growing through July and August. Luckily, monarch numbers were fairly high to start off the summer, so the population didn’t completely crash.
When the late summer monarchs left their northern breeding grounds in 2024, they faced large areas of drier-than-normal conditions through the US part of their migration (see September 2024 map above) that likely impacted available nectar, although conditions were better in Mexico. The final area of 1.79 hectares was an increase over an extremely low value of 0.9 hectares in the winter of 2023-2024.
2025 Weather Conditions
Conditions in 2025 were better than 2024. The July 2025 drought map below shows good conditions throughout most of the eastern North American monarch breeding range, and Monarch Larva Monitoring Project volunteers documented a strong increase in monarch densities in the second and third generations (see Wisconsin graph below).
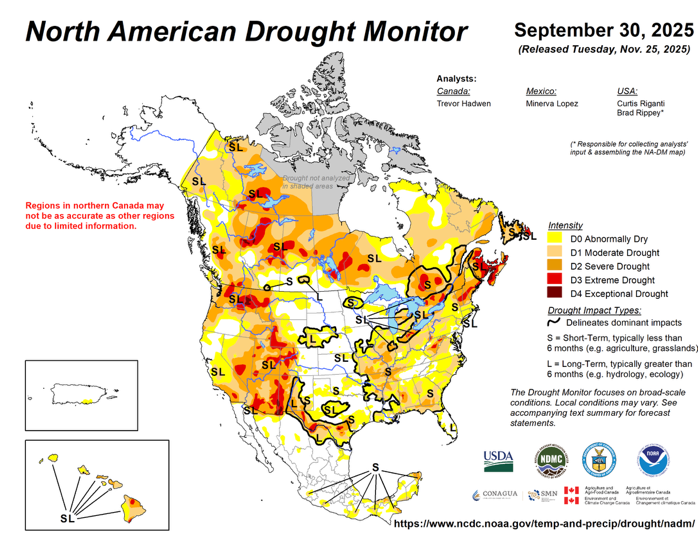
While there was more drought in late September 2025, the main part of the central flyway wasn’t too bad. Southern Texas was dry, but again, if monarchs made it through Texas, they faced good conditions in northern Mexico. Additionally, the wetter conditions throughout much of Texas in the summer meant that wet conditions still existed along rivers and low areas, providing important sources of the nectar needed to fuel the migratory flight.
The best way to support monarchs is to create more habitat throughout their range, thus providing resilience when some areas are dry.
It’s important that these habitats are free from harmful insecticides and that we advocate for decreasing the total amount of insecticides used throughout monarch breeding and migratory areas. We also need to do what we can to mitigate climate change. The conditions predicted by climate models do not bode well for monarchs, but they’ll also be harmful to us and most other organisms on Earth.
For background on the factors affecting monarch numbers, see this Monarch Joint Venture webinar on Climate, Weather, and Monarchs. Thanks to the U.S. Drought Monitor team (the National Drought Mitigation Center at the University of Nebraska-Lincoln, the National Oceanic and Atmospheric Administration, and the USDA) who provide important statistics on drought conditions throughout North America. Maps from https://droughtmonitor.unl.edu/NADM/Maps.aspx.


